Part 1: DataSet preparation | Impact of Pandemic in People’s migration pattern in Chicago

COVID-19 impacted almost all aspects of our lives. Lifestyle, Businesses, Education, Healthcare all had major impacts in the way they operate. This article is an investigative study of how the pandemic affected the way people migrate within major cities like Chicago, New York, San Francisco. We take Bike-Sharing programs as a proxy for people’s movement within the city. This study can be extended with other transportation systems like Public Transport, Taxi ridership, etc., but for this study we use the Bike Sharing data to observe people’s movement changes before and after pandemic.
Divvy is a Bike Sharing program in Chicago. There are bike stations with cycles docked all around the city. Customers can pickup bikes from a station and drop it off at any station. This service is in operation in Chicago from 2013. There are other similar bike sharing programs across the United States and in other countries. If you want to know more about this business, checkout this Wikipedia article.
Inspiration: As part of my academic project, I was looking for an interesting large dataset to analyze, visualize and build predictive models. After surfing through various open and public datasets, one dataset caught my attention — Lyft’s Divvy Ridership data. It is public, de-identified data available for public use. I had a nautral bias towards this dataset, as I’m an active user of Divvy. I yielded to the instinct, and decided to explore this dataset.
This is Part 1 of three part series. This part covers the dataset creation part. I couldn’t find any ready-to-go dataset to dive straight into analysis and model building. All I had was crude data, which needs to be processed to a workable dataset to proceed further.
Data Collection:
The raw data was made available by Lyft to general public. The data is hosted in an AWS Storage bucket — Divvy Tripdata. I wrote a Python script to download the data from this data store. Script first reads the index file, extracts the downloadable files URL, and downloads each data file and stores them in Google Drive/Local storage.
The storage was more like a data dump. The data dump was sharded differently for each year. For some years, the data was partitioned on a quarterly basis, some times as monthly partitions, or even combination of both. The data had other issues that needed to be taken care as well. The feature naming convention were inconsistent. Same feature had different names in each files. (Example: starttime, starttime, startingtime). Some years had additional features, which other years didnt have(example: tripduration, birthyear). The data had to be aggregated, cleaned and processed to make it usable and consistent.
Data Cleaning and Preprocessing:
The files are downloaded and are available locally. Eventually the next step is to merge the smaller shards to a proper dataset. Each shard in the downloaded files, is loaded into a dataframe using Pandas library. These individual dataframe are aggregated into larger, year-wise dataframes.
To deal with the inconsistent feature names, I came up with a standard naming convention for the naming the features. All columns in individual year-wise DataFrames were renamed to follow this standard.
Moving forward to the cleaning process, The station names and id’s are inspected. Analyzing the data, there were more than 2000 unique station ID’s and 1200+ unique station names. As per Divvy’s announcements in the past, there should only be around 900 bike stations in Chicago. Digging deep, I found out that Same station name was associated with different station id’s, and same station id’s were associated with different station names.
Additionally, some stations were moved from one location to another. This resulted in more unique station names. Stations are usually named after the street/crossing they are located at. When a station is moved, station name is modified to the new location, but the station ID remains the same. The stations are mostly migrated within the same block, so the station before and after migration still hold the same significance, and serve the same neighborhood. So, all records with the same station id, are set to the most recent station name.
Another issue with the station id: There were several temporary stations. Subsequent cleaning process fixed most of these records. The remaining records, which cannot be processed further were dropped.
Equally important features to the station names are starting and ending timestamps.
Number of records with missing starting or ending timesamp were calculated. It was minimal when compared with the size of the entire dataset. So, these records were dropped.
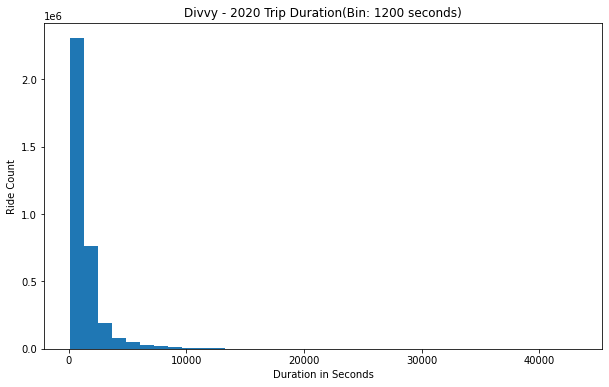
Trip duration: Only data of some years had values for the trip duration. For other years, tripduration was computed by using startingtime and ending_time of the ride. What can go wrong in this simple step? Everything. Very simple computation, but this step resulted in very interesting outcomes. Several records had negative trip duration. The trip duration was in negative, that is the user picks up the bike now, and drops it back in the past. Only possible reason I could think of is Time travel. Pick up a bike, travel back to yesterday, and drop it off. It sounds hilarious, but there were more than 15,000 records with such negative values. 15K seems a lot,but interestingly it only contributes to less than a half percent in the entire dataset. So these records were purged.
Re-docking paradox: Distribution chart was plotted using trip duration time. Looking at the graph, Considerable number of trip duration was less than a minute or two. It didn’t make any sense, as why would someone pickup the bike from the station and drop it off immediately. There are no nearby stations that can be traveled in under a minute or two. What could have been the reason? Customers could have decided not to travel, or wanted to switch to another bike. So they re-dock the bike. These re-docking don’t provide any useful information. Also this dataset’s intention is to help analyze people’s migration patterns. So its better if we remove these records from the dataset. All records under a minute trip duration are purged.
There were few records with missing end time, which means the bike is stolen or lost. These records were dropped.
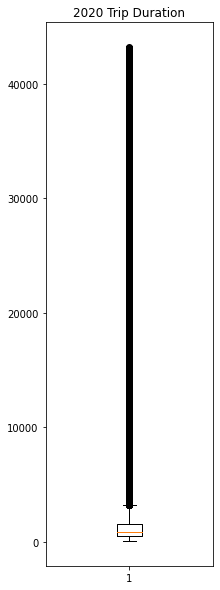
Some records had trip duration that lasted several days or weeks. To find out how many records of such type are present in the dataset, I used the whiskers box plot to see the distribution and statistical summary of the data. Such data points are just outliers. So records with trip duration with more than 12 hours are dropped. Find the trip duration box plot for the year 2020 in the image to the left.
Each record also had latitudes and longitudes of starting and ending destinations. It wasn’t a surprise anymore, these features had their own share of issues. Same station had multiple latitude and longitude values. I initially thought it could be due to station movement, but there were differences in lat-long values for the same station on same day, even during the same hour. To fix these features, I used another dataset from Divvy — Historical divvy bike stations dataset Data Portal — City of Chicago. This dataset had information on all stations, station id’s, lat-longs and number of docks in each station. I dropped the lat-long values in the primary dataset, and used the lat-long values from this supporting data.
As of other features are concerned, they were not present across all the datasets. And they are not computable features as well. So they were dropped. Example: Initial few years had birth year data of the customers, but later it wasn’t collected. So, to maintain consistency, the records have been dropped.
Now that I had a clean, proper and consistent dataset available, I was able to move ahead and proceed with the further analysis, visualization and predictive model building steps.
Dataset is now available in Kaggle for public use, please find the dataset here: https://www.kaggle.com/laxmena/divvy-ridesharing-dataset
Hypothesis
Some initial hypothesis I had and wanted to find answers for were:\
- How did Pandemic impact the business of Divvy?\
- Was there any change in movement pattern before and after COVID-19?\
- How did Government’s policy changes impact people’s preference of ride sharing?\
- Did the bike-sharing service recover after the pandemic? \
- If so, how did they recover, and when did they recover?\
- Compared to other cities like New York, San Francisco, which city recovered fast?
Results and findings of the analysis of these questions, are documented in the Part 2 of this article series. In the third part, I share about the visualization engine that I built to find the correlation between Covid infection rate and people’s migration pattern.
Please find the links to the next articles here:
Part 2: How did Covid impact Divvy, CitiBikes and BayWheels (Article link will be updated soon)
Part 3: Impact of Government’s policies in people’s preference in Ride-sharing | Migration pattern change before and after covid. (Article link will be updated soon)
Do subscribe to my newsletter to get notified about updates on my latest articles.